


How does an emerging economy go from exporting raw commodities or basic parts to dominating high-value global industries like electric vehicles or pharmaceuticals? In 2024, medicaments accounted for just 1.7% of world trade, but 34% of Slovenia’s total exports. Slovenia, therefore, exports 20 times its share of all medicament exports and demonstrates strong RCA in the sector, says the European Bank for Reconstruction and Development’s (EBRD) Transition Report 2026-27: Frontiers of Competitiveness released today.
The report analyses export specialisation patterns using RCA, which compares a product’s share of a country’s total exports to its share of world trade. RCA scores are further normalised to range from 0 to 1 by applying the transformation x/(1 + x), where values above 0.5 indicate an above-average market share and a meaningful comparative advantage. To ensure robustness, the analysis focuses on exports exceeding US$100,000 and a normalised RCA above 0.01.
Over the past three decades, many economies in the EBRD regions have substantially reinvented their export structures, moving up the value chain. In the median EBRD economy, products that have an RCA today but did not 25 years ago account for approximately 35% of total RCA exports. Furthermore, about 6% of today’s RCA exports are products that were not exported at all 25 years ago. This reflects a significant shift in production capabilities, technological advances, and skills upgrades.
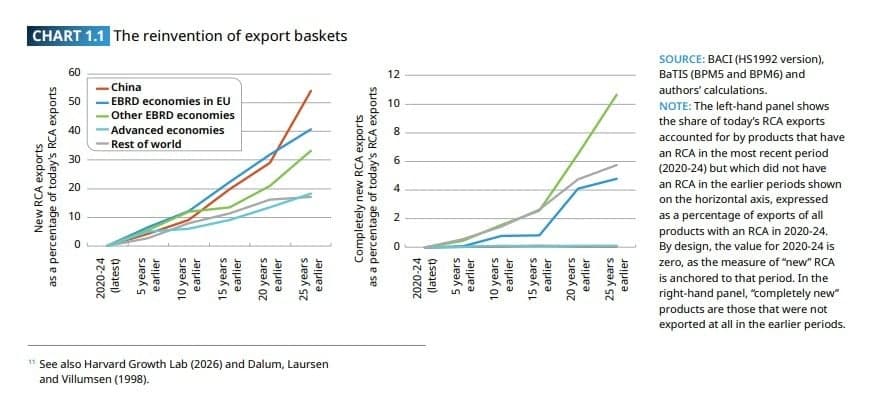
China has experienced the most pronounced transformation in export composition, followed by EBRD economies within the European Union. Notably, China’s export structure today bears greater similarity to Japan’s export profile from 1995-99 than to its own structure in that period.
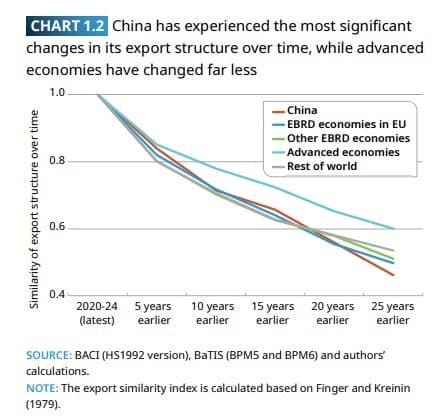
Advanced economies have undergone less dramatic, yet still significant, changes. Meanwhile, countries such as the Baltic states, Egypt, Türkiye, and Uzbekistan have expanded their range of export specialisations while retaining many of their earlier comparative advantages.
Attracting foreign direct investment has been shown to help countries develop RCAs. Top exporters, often multinationals, play a role in the development and marketing of new export products. FDI can raise the quality of exports, increase complexity across the economy through the development of sophisticated supplier networks, and boost productivity.
Global competitiveness on defence spending
The global competitiveness report findings on defence spending reveal significant disparities between advanced and emerging economies. In the United States, defence’s share of public R&D funding has been consistently above 50% since the 1980s. In contrast, defence R&D spending has averaged 2.5% of total public R&D spending in EBRD economies in the EU in recent years and 6% in Türkiye. Poland has raised defence’s share of public R&D spending from an average of 5% in 2005-21 to 10% since Russia’s military invasion of Ukraine in 2022.
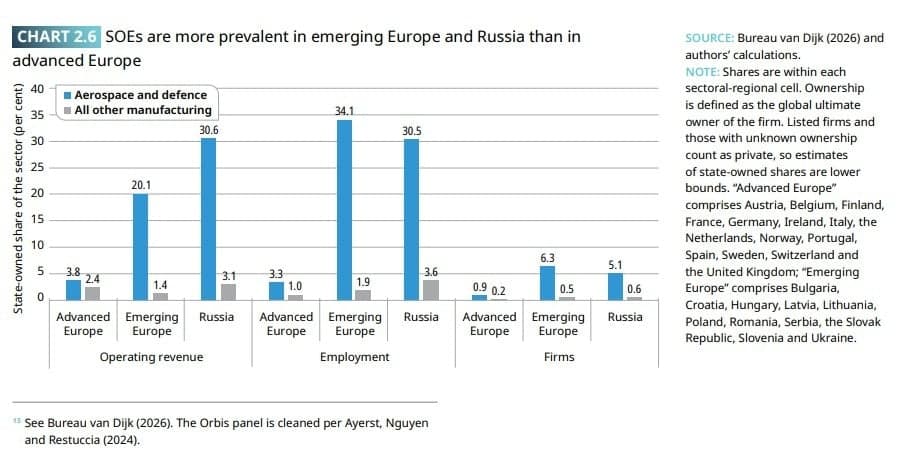
State-owned enterprises in emerging Europe account for 34% of the aerospace and defence sector’s employment and 20% of its revenue. The median private defence firm in advanced Europe is around 2.5 times as productive as the equivalent in emerging Europe. For state-owned firms, this differential rises to 6.6 times, with productivity measured as revenue per employee.
Public R&D creates knowledge spillover effects, as it is disproportionately directed towards fundamental, basic science. Spillovers from public R&D to the productivity of individual firms appear to be two to three times as impactful as private R&D spillovers.
Grants to small firms have been shown to generate three spillover patents from other firms for every patent produced by the grant recipient. Production under foreign licence can help firms build on foreign defence technology, with analysis of 10 major licensing agreements in Turkey showing that patents filed by Turkish firms increasingly cite patents held by firms supplying the licensed technology.
AI supply chain barriers and market concentration
Chip design involves deciding how transistors are arranged, depending on the unit’s purpose. For a frontier AI accelerator, this stage can take several years of engineering work and hundreds of millions of dollars in R&D expenditure. The fabless model now dominates the supply of AI accelerators, with NVIDIA accounting for an estimated 79% of global spending on AI chips in 2025. Designers capture most of the value, with margins retained by the designers of leading chips estimated at between 58% and 90% of the chip’s selling price.
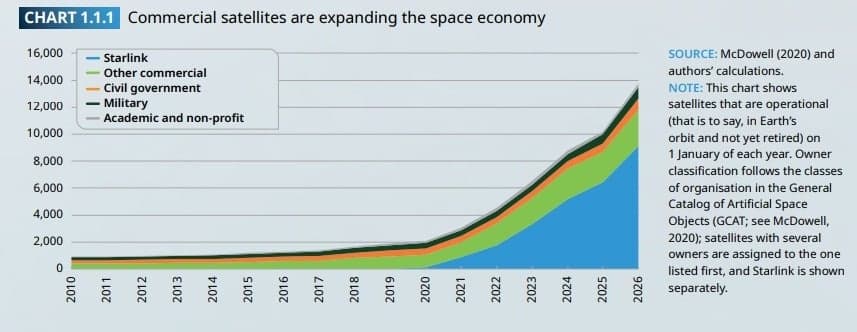
At the fabrication stage, frontier accelerators are built on the most advanced process nodes, requiring sophisticated manufacturing capabilities. The stock of active satellites has risen from about 2,100 at the start of 2020 to around 13,700 at the start of 2026, with commercial operators expanding the space economy. Technologies developed in the space sector have been adapted for use in crash-safety testing in the automotive sector and patient-monitoring systems in the healthcare sector.
How economies become globally competitive in new sectors
To become globally competitive, firms in EBRD regions require deeper venture capital markets and stronger connections between founders and investors. Across EBRD regions, business dynamism is slowing, with young, fast-growing firms accounting for a shrinking share of all businesses. The bottleneck lies in firm growth rather than firm creation, as companies entering the market remain smaller than advanced European peers at every stage of the lifecycle.
Growth stalls at the financing stage, with few firms that raise early funding progressing to institutional rounds. Venture funding per firm is scant, comes largely from abroad, is heavily dependent on founders’ educational and professional networks, and typically remains concentrated in a single city.
For example, Tunisia’s Startup Act, adopted in 2019, provides evidence on the effectiveness of targeted support measures. The programme introduced the “Startup Label”, a merit-based designation giving selected firms access to financial and regulatory benefits. By the end of 2022, labelled firms were 18 percentage points more likely to remain active than rejected firms, for which the survival rate was 53%.
Labelled firms increased their staff by an extra 110%, equivalent to two full-time workers on average. The programme generated TND 2.7 (€0.81) in benefits for every TND 1 (€0.30) of public expenditure, with an implied public cost per additional full-time job created of approximately TND 14,606 (€4,400).
New SME competitiveness index reveals regional gaps
The newly introduced SME competitiveness index provides detailed assessments across five key areas – bank financing, non-bank financing, legal frameworks, business skills and standards, and the business environment. Compared with the Bank’s broader measure of economic competitiveness, it puts greater emphasis on access to finance and legal frameworks for SMEs. This focus shows the reality that SME competitiveness revolves around those firms’ ability to grow in early stages of development, access finance, innovate, expand into new markets, and compete successfully with domestic and international firms.
Assessments of SME competitiveness and the competitiveness of the broader economy are closely, yet imperfectly, aligned. Between 2016 and 2026, increases in overall competitiveness have tended to outpace improvements in SME competitiveness, particularly in central Europe and the Baltic states.
This trend shows the importance of fine-tuning dedicated SME policies across the EBRD regions, with a focus on improving access to finance, skills, and legal frameworks for small firms.
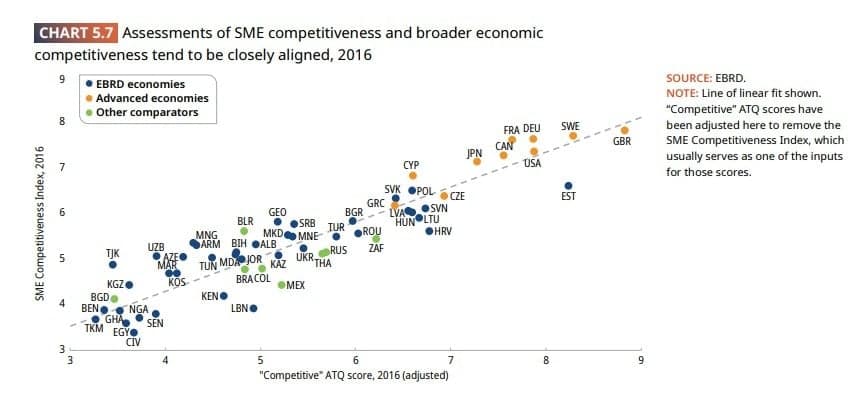
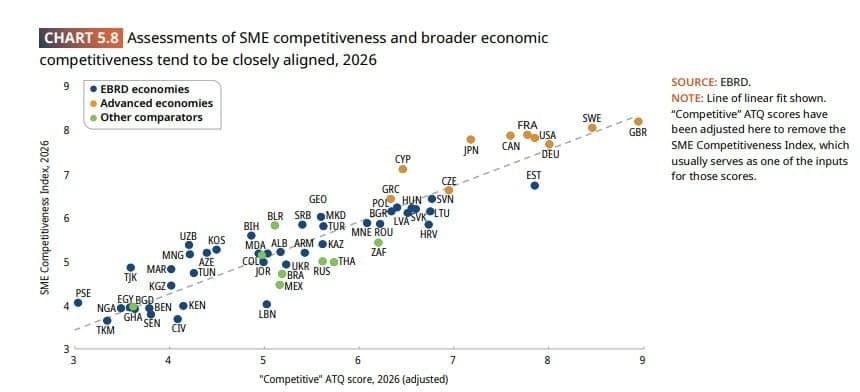
Economies like Azerbaijan, Kosovo, Mongolia, Tajikistan, Uzbekistan, and the West Bank and Gaza outperform their overall baselines in SME policy, driven in Central Asia by stronger legal frameworks and business environments, despite lingering gaps in non-bank financing.
Conversely, Croatia, Estonia, Lebanon, and Lithuania demonstrate stronger overall economic competitiveness relative to their SME support. Estonia performs on par with advanced economies overall but lags in SME non-bank financing like venture capital. Lithuania and Croatia compound this issue with restricted SME access to traditional bank loans compared to larger firms, while Lebanon trails in both financing access and supportive legal structures, such as insolvency frameworks.
Competitive SMEs are better able to adopt new technologies, access international markets, increase labour productivity, and withstand adverse economic shocks.
Policy directions and resource allocation
The policy challenge is to make good use of scarce public resources. With defence spending absorbing a growing share of constrained public budgets, support is best directed at factors that can help existing capabilities develop into new comparative advantages – skills, research infrastructure, access to finance, and regulatory frameworks that facilitate business growth.
Frictions in access to foreign capital are shaped by policy as well. Restrictions on foreign ownership work against the channel that supplies most startup finance at scale. Where prudential rules permit allocations to private equity and venture capital, those allowances often go unused, suggesting that regulatory frameworks require adjustment to mobilise domestic institutional capital effectively.
The implementation process, ongoing technical negotiations, and political developments across the EBRD regions will determine whether these findings translate into sustainable improvements in economic competitiveness.